


Humans constantly interact with their environment. They modify habitats, transfer species from one place to another, domesticate some species while contributing to the extinction of others. To reverse the process of extinction, we’ve been reintroducing taxa since the 1800s.
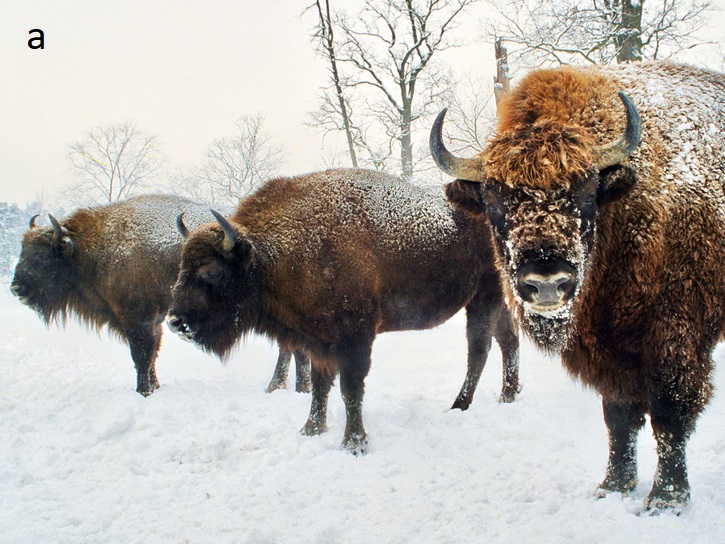
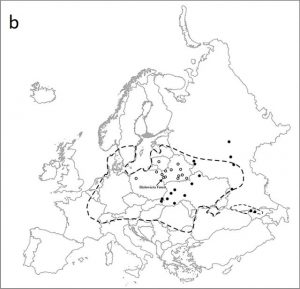
Reintroduction refers to the action of establishing self-sustaining and healthy populations of extinct or critically endangered species in areas they once called home, usually using individuals kept in zoos. The first use of the term in a conservation context was by Wilson (1832) where he documented the wood grouse reintroduction attempts in Scotland. Since then there have been many reintroduction attempts, one of which is the well-known gray wolf reintroduction to the Yellowstone National Park in 1995. Thanks to another reintroduction program European bison (Bison bonasus), which went extinct in the wild in 1927, has made a successful comeback. Started in 1924, this program continued with the initial release of individuals into the wild in 1952, and today there are over 2000 bison in captivity and around 5000 in the wild.

There are two genetic lines of bison established and maintained separately: the Lowland line and the Lowland-Caucasian line. From these, the Lowland line was founded by seven B. b. bonasusindividuals, while the latter was started using five additional individuals (though only one individual from the caucasicussubspecies). These genetic lines experienced strong founder effects and pedigree records have shown that they exhibit low levels of genetic diversity and high levels of inbreeding. Almost 70 years after the initial reintroduction, you might think that enough time has passed to recover from the bottleneck. How do you think one can test whether the bison populations have fully recovered? In a recent article published in the Journal of Heredity, Druet et al. (2020) detect their recovery levels using genomic and modelling approaches.
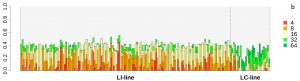
Druet et al. (2020) have genotyped over 22,000 SNPs in 183 Lowland and Lowland-Caucasian individuals that were born over the last 40 years. They focused on detecting homozygous-by-descent (HBD) segments on the genomes. These segments, also called Runs of Homozygosity, are long homozygous blocks where the same allele was inherited from both parents at each nucleotide position. As the length of HBDs increases, the number of generations to the common ancestor decreases which means being highly inbred. Population histories and past demographic events can also be inferred by looking at the distribution of HBDs in individual genomes.
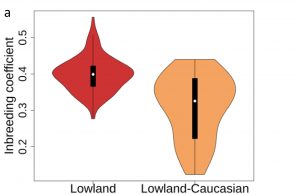
Using ZooRoH, a hidden Markov model, Druet et al. (2020) identified these HBD segments and measured the contribution of past generations of ancestors to the observed inbreeding. They found that both lines have high levels of inbreeding (0.4 in Lowland and 0.31 in Lowland-Caucasian) and the most recent common ancestor in the Lowland population goes 4-8 generations back, while the one in the Lowland-Caucasian population was 8-16 generations ago. The difference that those five extra founders of the Lowland-Caucasian population make is quite apparent.
Another find of the study is that the contribution of the most recent ancestors to the observed inbreeding is decreasing in both lines, as expected from expanding populations. This, together with the observation of decreasing HBD segment lengths, indicates that the reintroduction program has been successful in controlling inbreeding. Druet et al. (2020) has shown that the change in HBD segment lengths over generations can be used to monitor the efficiency of conservation and recovery programs.
Studies like this make clear that once a species goes extinct in the wild, it is a challenging and demanding task to bring it back to a self-sustaining state. This is why comprehensive in-situ conservation projects should be given priority and should be allocated more resources all over the world.
References:
Wilson J. 1832. Account of the introduction of the wood-grouse or capercailzie (Tetrao urogallus) to the Forest of Braemar. Edinburgh New Philosophical Journal 13:160–165.

Nihan D. Dagtas is a biologist and a member of the Ecology and Evolutionary Biology Society of Turkey. She combines modern and archaeogenomic data to document genetic diversity changes and resolve population histories of domesticated animals and humans. After working as a lab manager at the University of Oklahoma’s LMAMR, she is now going back to grad school to uncover evolutionary mysteries. Nihan tweets at @nihanddagtas.